Pulmonary Acoustics in Excised Lung
Pulmonary Acoustics In Excised Lung Heading link
The study of pulmonary acoustics in preserved pig lungs helps evaluate the computational acoustic model.
Experiment Setup Heading link
Experiment Setup
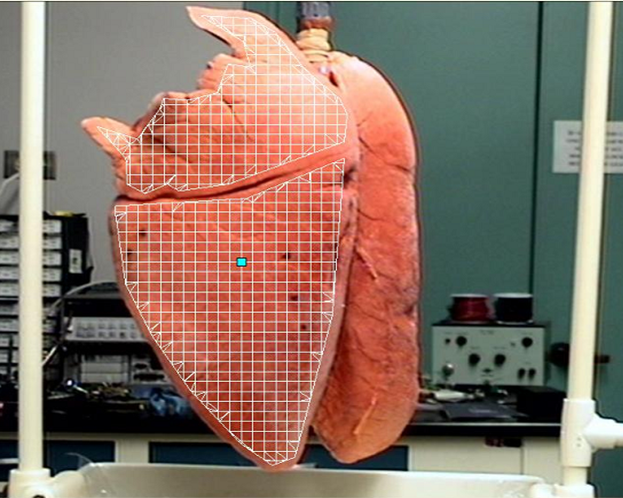
- A preserved pig lung (ENasco, Fort Atkinson, WI) was hung under a frame and inflated to a pressure of 20 cm H2O transpulmonary pressure for one hour before the experiment to help open the airways.
- Broad band sound (periodic chirp with spectral content from 50 to 1000 Hz) generated by a speaker was sent into the excised lung via the trachea.
- Surface velocity at different locations of the whole lung was measured using a scanning Laser Doppler Vibrometer (Polytec PSV-400).
Simulation & Experimental Validation
Finite element (FE) simulation of sound transmission in the pig lung was conducted in Comsol 4.3a. Lung and airway geometry was constructed from CT scan image segmentation.


Lung and airway FE mesh Simple (left) and complex (right) airways.
Lung normal surface velocity magnitude (dB m/s for 1 Pa input acoustic pressure)
The following are three examples of experiment (b) simulation, lung with simple airway (c)simulation, lung with complex airway (d) Animation of experimental measurements
3 Experiments Heading link
300 Hz


500 Hz


800 Hz


3 Experiments Continued Heading link
Simulation of real part of airway acoustic pressure (Pa) at 300, 500 and 800 Hz:
(a) Simple airways
(b) Complex airways
300Hz

500 Hz

800 Hz

Stacked horizontal slices of the real part of the lung Heading link
Stacked horizontal slices of the real part of the lung velocity in the anterior- posterior direction and airway acoustic pressure at 300, 500, and 800 Hz by simulation.
(a) lung with simple airway
(b) lung with complex airway
300 Hz

500 Hz

800 Hz

Simulation of sound transmission in lung with tumor Heading link
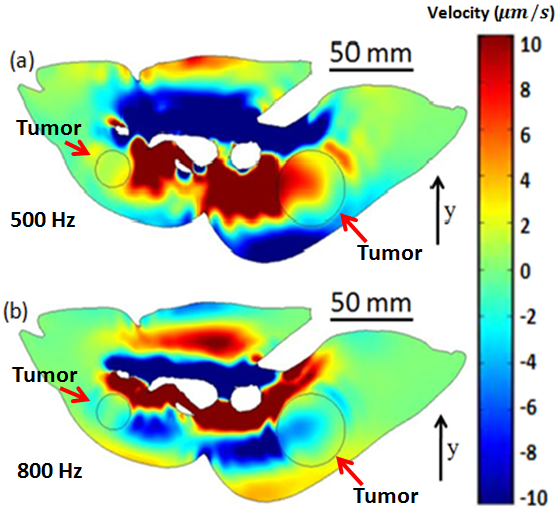
- Cross-section Images the real part of the velocity in the anterior- posterior direction for the lung with tumor.
- The tumor alters the wave patterns in the lung parenchyma.
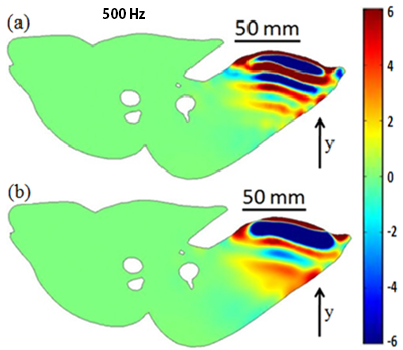
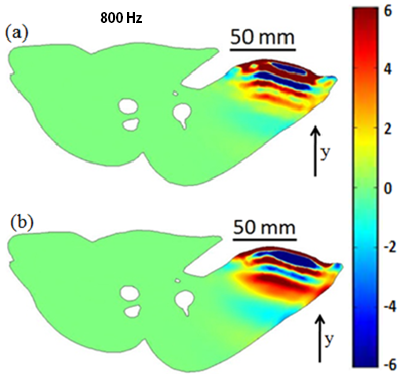
Simulation of shear wave propagation on normal and fibrotic lung
Cross-section Images of the real part of the lung velocity in the anterior-posterior direction (see arrow) in mm/s (a) normal lung, (b) fibrotic lung.
Fibrosis increases the lung shear stiffness, thus larger shear wave length is visualized in the fibrotic lung.